Sunday, October 3, 2010

4M-Exercise

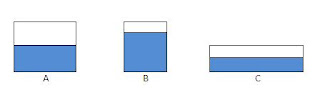
1. Table below shows the result of the investigation. The time taken to send mail from Kuala Lumpur to Kota Kinabalu by four different methods.

(a) Which method of sending mail takes the shortest time?


(b) Predict the method that u mentioned in (a).


(c) State the following belows:

i) What is changed :

ii) What is measured :


(d) State the aim of the investigation above?


2. Diagran above show two nails in a beaker placed in wet area.

(a) Which nail is going to rust?


(b) Give a reason (inference) for your answer in (a).


(c) In this investigation, state what should be kept the same.


(d) Suggest two methods that can be used to prevent rusting.

i.

ii.


3. Four materials J, K, L and M, of the same size are immersed in separate beakers, each containing 100 ml of water for 10 minutes. The table below shows the final amount of water each materials is taken out from beaker.

(a) What is the purpose (aim) of the investigation?


( b) Which materials is the most absorbent object?


(c) Give a reason (inference) for yopur answer in (b)


(d) Predict the materials that can be used to make these objects.


4. Diagram below shows three objects used to compared the size of the Sun, the Earth and the Moon ia a simulation.


(a) What do the objects represent?

i. The glass marble :

ii. The basketball :

iii. The grain of sago :


(b) What is the relative size of the moon to the size of the Earth and the size of the Sun?


(c) All the planets moves around the Sun in thier own orbit. State the relationship between the size of orbit of the planet and the time taken for the planet to complete the movement around the Sun.


Thursday, September 30, 2010

5M-Exercise


1. Diagram above shows the apparatus used by 5M pupils in an investigation. All the cylinders are placed on the cardboard.The cardboard lift up slowly. The time taken for each cylinder to fall down are recorded.

(a) What is the aim of the investigation above?


(b) In this investigation, state the following below:

i) What is changed :

ii) What is onserved :

(c) Give a reason (Inference) to explain your observation in this investigation.


(d) State the relationship between size of the base area and the stability of the structure.


(e) In this investigation, state two variables that should be kept the same.


(f) State another factor can effect onto the stability of structure.

Wednesday, September 29, 2010

Milk Carton Bird Feeder

Here's how to recycle a milk carton or juice carton to make an excellent bird feeder for finches, sparrows, chickadees and other small feathered visitors to backyard bird feeders.

This design protects the bird seed from rain and snow, which is very useful in the winter months when many bird feed platforms become snow covered and unusable. Don't forget, however, that feeding the birds is a year-long committment; during the nesting season in spring and summer, the nutritional needs of many birds increases tremendously as they work to build nests and feed their young.

To make a Milk Carton Bird Feeder, you will need:

  • milk or juice carton
  • craft knife or scissors
  • wax pencil or crayon
  • ruler or straight edge
  • two small lengths of double-sided tape
  • two bamboo skewers or straight, small diameter twigs to use as perchs
  • bird seed
  • hole punch
  • twine to make a hanger


Milk Carton Bird Feeder
Instructions:

1. Use the wax pencil and ruler to draw the shape of the opening on the front of the milk carton, as shown in the diagram at right. The opening looks like the outline of a house with a peaked roof. You should allow about two inches at the bottom of the carton to hold a good amount of seeds.

2. Use the craft knife to cut out the opening. Younger children will need an adult to help with this part.

3. Using the top of the peak as a center point, fold the piece of milk carton that you just removed in half along its length. Make a half inch cut from the point of the peak down the center fold. Fold up a half inch flap on either side of this cut, as shown in the diagram at right.

4. Attach a length of double-sided tape to each flap.

5. Insert this roof piece into the top of the opening and use your fingers to press the flaps against the inside of the milk carton until the double-sided tape holds securely.

6. Poke a bamboo skewer or thin straight twig through the wall of the milk carton, just below the left side of the opening. Repeat on the right side. Poke skewers all the way through and out the back wall of the carton. This keeps the perches straight and secure.

7. Use a hole punch or a skewer to punch two holes through the top line of the carton.

8. Thread twine through the two holes to make a hanger.

9. Fill the bottom of the feeder with nyger seed or a small bird seed mixture. Hang your milk carton bird feeder from a tree branch that you can reach easily when you need to add more bird seed.

Suggestions:

If you plan to do a lot of bird watching, hang the feeder in a spot that you can see clearly from a window. If the bird feeder is some distance away, use binoculars or a spy glass to see the birds up close.

Buy a good bird identification book and keep a record of all the species that turn up at your backyard feeding station. Record the date that you saw each bird, whether it was a male or female, or a pair of a birds. You may also want to add other observations about their size, appearance, special markings and behaviour.

Research the birds that you see to find out what types of foods they prefer, or experiment by offering different types of bird seed in your bird feeder to find out for yourself.

Sunday, September 26, 2010

4M - Examples Of Objects

a) Gives 3 examples of objects for each shapes below:

1. Cone

a) ____________________

b) ____________________

c) ____________________

2. Cube

a) ____________________

b) ____________________

c) ____________________

3. Cuboid

a) ____________________

b) ____________________

c) ____________________

4. Cylinder

a) ____________________

b) ____________________

c) ____________________


5. Sphere

a) ____________________

b) ____________________

c) ____________________

6. Hemisphere

a) ____________________

b) ____________________

c) ____________________

7. Pyramid

a) ____________________

b) ____________________

c) ____________________

8. Prisme

a) ____________________

b) ____________________

c) ____________________


b) The pictures below shows example of structures. Identify and label the shapes that you can found in the pictures below:

i)


ii)


The Shapes Of Objects

1. Cube


2. Cuboid


3. Cone


4. Cylinder


5. Sphere


6. Pyramid


7. Prisme


Sunday, August 29, 2010

The Movements Of The Earth and The Moon

The Movements Of The Earth

1. The Earth moves around the Sun in their own path.
2. The path is called the orbit.
3. Each planets have their own orbit. The bigger the size of the orbit is, the longer the time taken takes by planet to complete one revolution moves around the sun.
4. The Earth takes around 365 days to complete one revolution moves around the sun.


The Movement Of The Moon

1. The Moon moves around the Earth in their own path.
2. The path is called the orbit.
3. The Moon takes around 27 days to complete one revolution moves around the Earth.
4. The movement of the Moon can cause the phases of the moon.
5. The phases of the moon shown in diagram below.

Rotation Of The Earth

Note :-
1. Earth rotates its own axis from west to east.


2. The Earth takes 24 hours to complete one rotation.
3. The rotation of the Earth can cause:-
a) The changing the direction and length of the shadow.


b) The occurrence of the day and night

Tuesday, August 24, 2010

Pre-PKSR 2 Answer

Question 1

(a) Increasing / Increases / Increase
(b) Because the liquid Q becomes neutral
(c) pH value of liquid Q
(d) The volume of soap water added increasing / increases / increase // more, so the pH value of liquid Q increasing / increases / increase // more // Vice Versa
(e) To study / investigate / find out the realtionship between the volume of soap water added and / with the pH value of liquid Q

Wednesday, August 4, 2010

ANSWER-TRIAL UPSR 2010

Section B

Question 1

(a) Because animals in cage Z is more active than animals in cage Y //

Cage Z puts under sunlight than cage Y puts indoor

(b) Decrease, increase, decrease, increase, decrease

(c) 1. Time

2. Air temperature of animals cage

3. Type/size/number of animals

(d) The air temperature in cage Z higher than air temparature in cage Y / (vice versa)

Question 2

(a) To study/investigate/find out the relationship between the time/position of the sun and/with direction of the shadow.

(b) Time // Position of the sun // direction of the shadow // height of pupils /Kelvin / place of the investigation.

(c) Position of the sun is at the west, direction of the shadow is at the east / (vice versa)

(d) Because the rotation of the Earth on its own axis from west to east.

Question 3

(a) To study/investigate/find out the relationship between the size of container/surface area and/with volume of water after one hour.

(b) Volume of water in each container decreasing because the water evaporate to the surrounding.

(c) Air humidity // Air movement // Surrounding temperature

(d) The sorrounding temperature increase / more, the volume of water left decrease / less // (vice versa)

Question 4

(a) Because Q is having total eclipse // umbra.

(b) Surrounding temperature decreasing // the Sun suddenly disappear.

(c) Light travels in straight line / cannot pass through opaque object.

(d) To study/investigate/find out the relationship between the time and/with stages of the eclipse.

Question 5

(a) To study/investigate/find out the relationship between the type of harvesting methods and/with amount of harvested crops.

(b) Methods K take shorter time.

(c) It use more time / energy.

(d) Technology / machines makes works easier / faster.

Thursday, July 29, 2010

Exercise : Materials Year 5

1. Which of the following examples is a solid?
A. Fruit juice
B. Cooking oil
C. Oxygen
D. Sponge

2. The process in which cloud is formed is called
A. melting.
B. freezing.
C. condensation.
D. evaporation.

3. ______________ can changes the ice cube to water.
A. Melting.
B. Freezing.
C. Condensation.
D. Evaporation.

4. Raju did an experiment on the evaporation of water. He put 50ml of water in each container at the beginning. After 3 hours the results of the experiment shown in diagram below.

(a) What is the aim of the investigation?


(b) State two variable that should be kept the same.


(c) Give a reason (inference) based on the observation above.


(d) In this investigation, state the following variable:-

i. What is changed :

ii. What is measured :


(e) State the relationship (hypothesis) between the two variable that your mentioned in (d)


(f) State the relationship (hypothesis) between the surrounding temperature and the rate of evaporation.


(g) What conclusion can be made in this investigation?

Foods: are they Acid or Alkaline-forming?

Note that a food's acid or alkaline-forming tendency in the body has nothing to do with the actual pH of the food itself. For example, lemons are very acidic, however the end-products they produce after digestion and assimilation are alkaline so lemons are alkaline-forming in the body. Likewise, meat will test alkaline before digestion but it leaves acidic residue in the body so, like nearly all animal products, meat is classified as acid-forming.

It is important that your daily dietary intake of food naturally acts to balance your body pH. To maintain health, the diet should consist of at least 60% alkaline forming foods and at most 40% acid forming foods. To restore health, the diet should consist of 80% alkaline forming foods and 20% acid forming foods.

FOOD CATEGORY Alkaline Acid High Acid
BEANS, VEGETABLES, LEGUMES Vegetable Juices, Parsley, Raw Spinach, Broccoli, Celery, Garlic, Barley Grass Pinto Beans, Navy Beans Pickled Vegetables
FRUIT Dried Figs, Raisins Canned Fruit
GRAINS, CEREALS
White Rice, White Bread, Pastries, Biscuits, Pasta
MEAT
Fish, Turkey, Chicken, Lamb Beef, Pork, Veal, Shellfish, Canned Tuna & Sardines
EGGS & DAIRY
Eggs, Camembert, Hard Cheese Parmasan, Processed Cheese
NUTS & SEEDS
Pecans, Cashews, Pistachios Peanuts, Walnuts
OILS


BEVERAGES Herb Teas, Lemon Water Wine, Soda/Pop Tea (black), Coffee, Beer, Liquor
SWEETENERS, CONDIMENTS Stevia Milk Chocolate, Brown Sugar, Molasses, Jam, Ketchup, Mayonnaise, Mustard, Vinegar Artificial Sweeteners

Tuesday, July 27, 2010

Why We Need Clean Water

Ten Reasons Why We Need to Clean Water

1. Clean water is vital to the human body.

The human body is 50 to 70 per cent water, and needs a regular supply of clean water to maintain health. We need clean drinking water. We need clean water for cooking and making beverages. Healthy eating and clean water go hand in hand. We must work to clean water worldwide in order to maintain sufficient sources to supply this need.

2. Clean water is vital to our food.

If we fail to clean water and keep it clean, we will be shut up to a diet of contaminated food. Not only fish, but other meats, fruits, and vegetables will deliver contamination to us. If we want healthful, clean fish to leap forth from rivers, streams, and oceans, we will have to clean water. If we want healthful, organic produce, we will have to clean water used to irrigate produce.

3. Clean water is vital to human health.

Clean drinking water is vital to health, yet the UN and the World Health Organization (WHO) report that 1.1 billion people around the globe lack access to clean drinking water. The health consequences are devastating. The UN attributes 2.2 million deaths annually to poor water and sanitation. If we clean water, provide better sanitation, and teach people how to keep water clean, future generations can enjoy longer and healthier lives.

4. Clean water is essential for water sports.

A swimmer in clean water is safe from illnesses and diseases produced by contaminated and toxic water. A surfer does not have to fear swallowing water in a wipe out. Boaters and others who use our water for recreation can relax without concern about pollutants. Yet, 27 years after the passage of the 1972 Clean Water Act, 40% of our rivers, lakes, and estuaries were still too polluted for safe swimming and similar water sports.

5. Clean water is essential for fish and other wildlife species.

As humans, we must consider the needs of fish, whales, water fowl, and other wildlife species that live in water. We must clean water when there are oil spills, of course, but we must also work to clean water flowing into our oceans, lakes, rivers, and streams. We must clean water for wildlife that does not live in the water, but depends on clean water for health and cleanliness.

6. We need to clean water to cut down on our carbon footprint.

The emissions involved in producing bottled water are astounding. Pablo Päster, Sustainability Engineer and MBA, did a thorough and exhaustive study of the cost of bringing a single liter of Fiji Water to America. He found that bottlers use nearly seven times as much water to bottle it than you actually drink. The total amount of water used to produce and deliver one bottle of imported water is 6.74 kg! In the process of making the bottle, getting water into the bottle, and delivering it to you, 250g of GHG emissions were released.

7. We need to clean water to cut down on refuse.

Each plastic drinking-water bottle takes hundreds of years to biodegrade in a landfill. Many plastic drinking-water bottles litter the countryside. Some will be recycled, but the recycling process is said to pollute the environment with toxic carcinogens. If we clean water so that it is truly free of contaminants, additives, bacteria, and virus, people are less likely to rely on bottled water.

8. Clean rain and snow are not givens.

Rain is just one step in the water cycle. Pure rain does not automatically fall through the universe, filtered by the atmosphere and delivered from pure clouds. Neither does pure snow. The rain, snow, and other precipitation we receive find their way into the sky from bodies of water on earth. If we fail to clean water on earth, we will have increasingly polluted precipitation. Polluted precipitation is harmful to everyone and everything on which it falls.

9. We need clean water for all-around cleanliness.

Whether it's your laundry in the Maytag washer, your carpet beneath the cleaning machine, or your body under the shower, clean water is necessary for all-around cleanliness. From early preschool years onward, children are taught proper hygiene - and it depends on clean water.

10. The consequences of inadequate access to clean water are too great.

Many have expressed growing concern that water wars are more likely in the future than current battles for oil. Where access to clean water is the very essence of life, "no water" may mean "no peace." A failure to clean water now may result in global warfare for future generations.

You may be able to add more reasons. You may substitute different reasons, but the bottom line is still the same. We need to clean water.

How To Keep Our Water Resources Clean

How is Water Pollution Caused?

Although certain natural processes may cause some of the water pollution, however, human activity is the largest cause of our seas, rivers and lakes getting polluted. We need to use water everyday both in our industries as well as our homes. We get this water from groundwater sources, rivers, and lakes, and after using it, and often contaminating it, most of this water gets back into the rivers, lakes, and oceans.

The used water from agricultural and industrial practices, and household use create wastewater, also referred to as sewage. If this is allowed to flow back into water systems without being treated, it causes pollution, which results in harming both humans as well as animal life. Water also gets polluted when there is a runoff of rainwater from industrial, agricultural, and urban areas, which flow directly through stormwater drains into water systems without any treatment.

The disposal of sewage is a major problem in developing countries where there isn’t adequate sanitation in large areas, thus carrying disease causing bacteria and viruses into sources of water. In countries that are developed, people often flush pharmaceutical and chemical products into their toilet.

Some of the other causes of pollution are oil spillages and dumping in oceans, dumping litter into streams, rivers, and oceans such as cardboard, newspaper, foam, Styrofoam, plastic packaging, aluminum, glass, and so on. Some of these take a very long time to degrade, e.g., plastic packaging can take 400 years, Styrofoam takes 80 years, foam takes 50 years, and aluminum takes 200 years.

Nuclear waste, atmospheric deposition, and underground storage leakages are some of the other causes of water pollution.

What are the Ways to Prevent Water Pollution?

While we need to see to it that the government is stringent about seeing to it that there are adequate treatment plants to treat sewage, and seeing to it that industries have treatment plants and nuclear plants have proper waste storage systems for radioactive material, and so on, there are many things that we can do individually to prevent water pollution. Given below are a few ways to prevent water pollution:
  • Toxic products like paints, automobile oil, polishes, and cleaning products should be stored and disposed off properly. As a matter of fact, it is better to use non-toxic, products for the house as far as possible. Also, never dispose off such products by throwing them into your toilet or sink.
  • Dispose off your trash in a proper manner and try and incorporate the recycling habit as far as possible. Non-degradable products like tampons, sanitary napkins, and diapers should not be flushed down the toilet, for these can end up damaging the process of sewage treatment, and usually end up as litter on beaches.
  • Refrain from throwing litter into streams, lakes, rivers, or seas. If you do spot litter on beaches or in water systems, after ascertaining that it is safe, collect them and dispose off them in any nearby waste disposal system.
  • Try using environmentally friendly household products like toiletries, soap-based household cleaning material, and washing powder as far as possible.
  • Try using natural fertilizers and pesticides as far as possible, or if not, do not overuse them or over-water gardens and lawns. This will help in reducing the pollutants that get into water systems due to runoffs.
  • Automobile oil should be re-used as far as possible. Also, it is important to keep your automobile well maintained in order to prevent leakages of toxic fluids like antifreeze and oil.
  • Also, actively conserve water by turning the tap off when you do not need running water, such as while brushing teeth. Apart from preventing water shortages, it lessens the amount of water that needs to be treated.

Thursday, June 10, 2010

SET 3

1. Diagram 1 shows the apparatus set up used in an investigation. Three different type of materials were sprinkled on plank Q separately.

Diagram 1

The result of the investigation are recorded in Table 1.

Table 1
(a) What is the aim of the investigation?


(b) State two variable that should be kept the same.


(c) Give a reason (inference) based on the observation above.


(d) In this investigation, state the following variable:-
i. What is changed :

ii. What is measured :

(e) State the relationship (hypothesis) between the two variable that your mentioned in (d)


(f) What can you say about the changing in the distance travelled by the toy car before it stopped moving?


(g) What conclusion can be made in this investigation?


Diagram 2

2. Kenneth and Wong used the apparatus set up in Diagram 2 above to carry out an investigation.

Observation : Object K can float higher from the bottom of the beaker than object L and M


(a) What is the aim of the investigation?


(b) State two variable that should be kept the same.


(c) Give a reason (inference) based on the observation above.


(d) In this investigation, state the following variable:-
i. What is changed :

ii. What is measured :

(e) State the relationship (hypothesis) between the two variable that your mentioned in (d)


(f) Rearrange the ability of object to float in increasing order


(g) What conclusion can be made in this investigation?


3. Table 2 below shows the information gathered in an investigation that involved four types of animals, E, F, G and H.

Table 2
(a) What is the aim of the investigation?


(b) State two variable that should be kept the same.


(c) In this investigation, state the following variable:-
i. What is changed :

ii. What is measured :

(d) State the relationship (hypothesis) between the two variable that your mentioned in (d)


(e) Give one reason (inference) on the number of eggs lay by animal H


(f) What conclusion can be made in this investigation?


Table 3
4. Table 3 shows the temperature of the region P on a certain time.

(a) What is the aim of the investigation?


(b) State the variable that should be kept the same.


(c) In this investigation, state the following variable:-
i. What is changed :

ii. What is measured :

(d) What is trend of the changing in the temperature of region P over one day.


(e) Predict the temperature of region P at 12.00 a.m.


(f) What conclusion can be made in this investigation?


5. Table 4 shows the information gathered in an investigation on several planets in the solar system.


Table 4
(a) What is the aim of the investigation?


(b) State the hypothesis can you make in this investigation.


(c) In this investigation, state the following variable:-
i. What is changed :

ii. What is measured :

(d) What is trend of the changing in the temperature of planet above.


(e) Give a reason to your answer in (d).


(f) Predict the position of a planet that takes 225 days to make one complete revolution around the sun.


(g) What conclusion can be made in this investigation?


Wednesday, June 9, 2010

Set 2 - Bar Chart

1.

Diagram 1
The bar chart in Diagram 1 shows the information gathered in an investigation on the population animal Q in forest X.

(a) State one reason (inference) about the population of animal Q from year 2000 to year 2008.


(b) In this investigation, state the following variable:
i) Manipulated variable (Changed) :
ii) Responding variable (Measured) :

(c) Predict the population of animal Q in year 2010


(d) In this investigation, state the variable that should be kept the same?


2. Diagram 2 shows a bar chart drawn based on the information gathered in an investigation


Diagram 2

(a) Write an inference about the pollution index in region S and T.


(b) Predict the

i. Region S :
ii) Region T :


(c) Give two suggestion how to reduce pollution in region S.


Diagram 3

3.The bar chart above shows the results of the investigation gathered by a scientist on the population of living thing Q.

(a) State the purpose (aim) of the investigation.


(b) In this investigation, write your hypothesis.


(c)In this investigation, state the following variable:

i) What is changed (Manipulated Variable):

ii)What is observed (Responding Variable):


(d) State the relationship between what is changed and what is observed


(e) Give a reason (inference) for your observation above?


The number of tree are cut down by people affected to the number of living thing in a habitat.

(f) Base on the statement above, write a relationship between manipulated variable and responding variable.

Tuesday, June 8, 2010

Set 1- Picture

Diagram 1

1. A group of pupils was carry out an experiment to study the relationship between the number of seedling in the two similar pots as shown in diagram below.

(a) State the aim of the investigation.


(b) In this investigation, write your hypothesis.


(c)In this investigation, state the following variable:

i) What is changed (Manipulated Variable):

ii)What is observed (Responding Variable):


(d) State the relationship between what is changed and what is observed


(e) Give a reason (inference) for your observation above?


The growth of plants depends to the amount of the fertilizer givens.

(f) Base on the statement above, write a relationship between manipulated variable and responding variable.


Diagram 2
2. Diagram 2 above shows three boys climb up a rope. The result of the investigation shows in Table 1 below.

Table 1
(a) State the aim of the investigation.


(b) In this investigation, write your hypothesis.


(c)In this investigation, state the following variable:

i) What is changed (Manipulated Variable):

ii)What is observed (Responding Variable):


(d) State the relationship between size of the boys and the height the boy climb up the rope.


(e) Give a reason (inference) for the height climb up the rope by Sam?


(f)In this investigation, state the variable that should be kept the same.


(g) Based on the result in Table 1 above, what can you say about changing in the height of climb up.


3. A girl walked up a stairs a shown in Diagram 3. She repeated walking up the stairs of different height. The time taken to reach on the top of stairs is recorded.


Diagram 3

Table 2 below show the result of the investigation.

Table 2
(a) What is the aim of the investigation?


(b) What is the trend in the changing in the time taken to reach the top of the stairs?


(c) In this investigation, state the following variable:

i) What is changed (Manipulated Variable):

ii)What is observed (Responding Variable):


(d) State the relationship between w
hat is changed (Manipulated Variable) and what is observed (Responding Variable) in this investigation.


(e) Predict the time taken to reach the top of the stairs if its height is 2 m.


4. Diagram 4 shows the set up of experiment by a group of pupils. They want to investigate the factors that affect the stability of a structure.


Diagram 4
(a) State your observation when the cardboard lift up.


(b) Write your inference for your answer in 4 (a)


(c) In this investigation, state the following variable:

i) What is changed (Manipulated Variable):

ii)What is observed (Responding Variable):

(d) Rearrange the models above according to their increasing order of the stability.


(e) State two variable that should be kept the same.


(f) What conclusion can you make from the experiment above?

How to answer question in section B

here a few tips how to get a better score in section B...dont tink it so hard..just relax..

1. Aim

To study/investigate/find out the relationship between (what is change/manipulated variable) and/with (what is observed/responding variable)

2. Hypothesis / Relationship / Conclusion

The (what is change/manipulated variable)(increase/decrease), the (what is observed/responding variable)(increase/decrease)

3. Inference

(Observation) because (Reason/explanition for the obsevation)

4. Trend

State the changing of the value base on the data/information givens

5. Predict

Estimate the logical value